Read the available data
Published observations describe a specific geography and period. They provide context but do not automatically represent the price of an individual property.
Local market
A careful view of the Anjou market, where every published number identifies its source, period, and geography.
Estimate my home →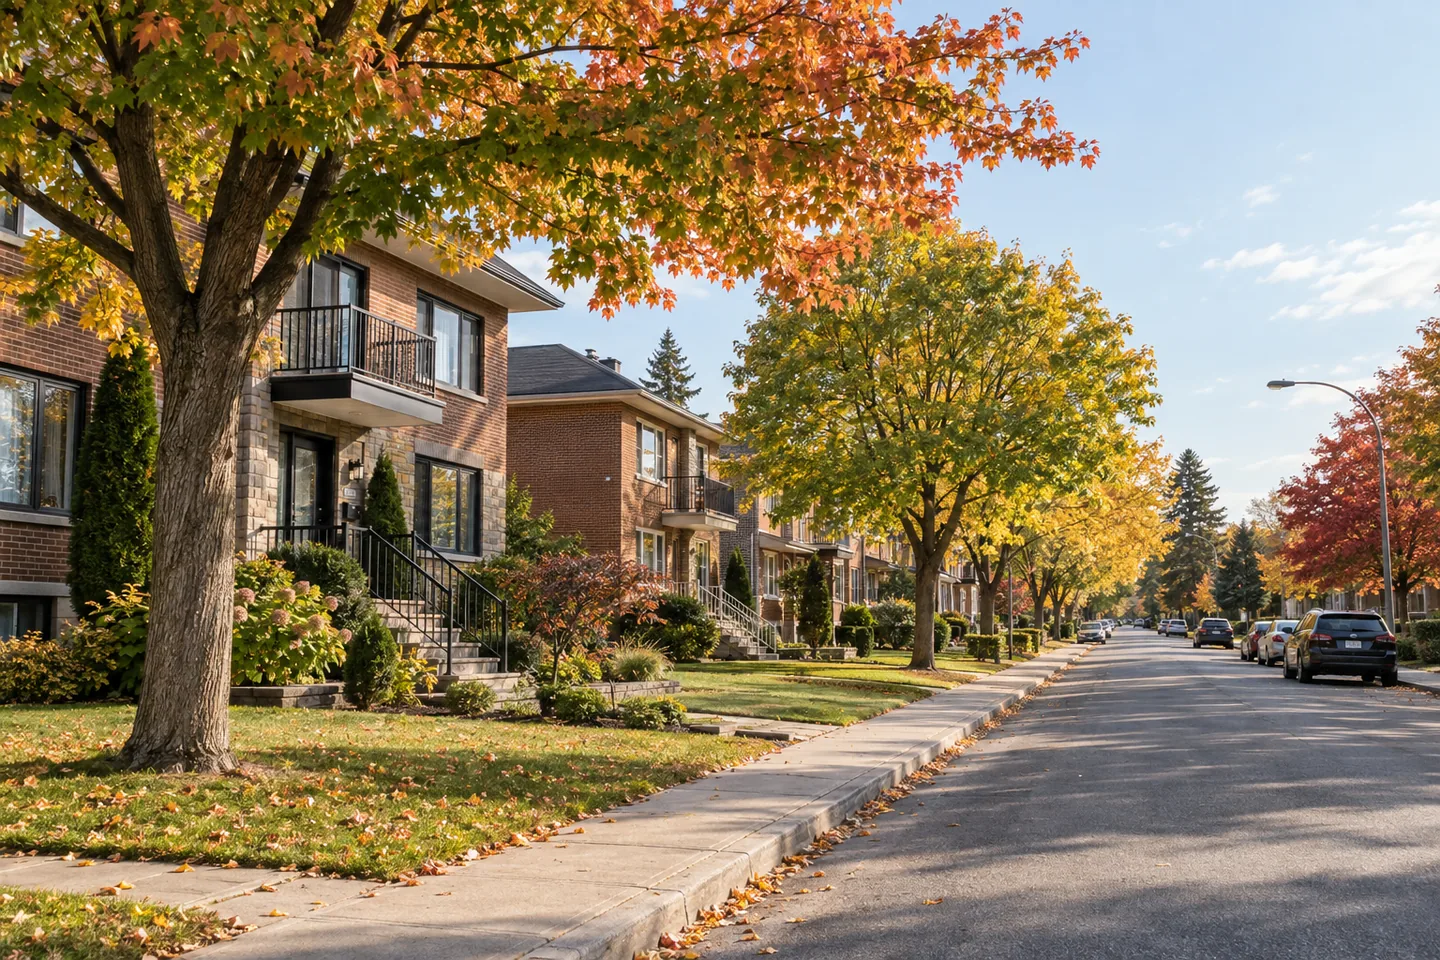
Understand the area
Anjou combines residential streets, commercial hubs, and municipal facilities in an area crossed by major routes. Context can change significantly from one address to another, so proximity to parks, services, or major roads should be checked at the property level.
Three ways to read the context
Published observations describe a specific geography and period. They provide context but do not automatically represent the price of an individual property.
Building type, area, condition, lot, and micro-location should be aligned before drawing a market conclusion.
Markets change. Older data remains useful only when its date and the changes since then stay visible.
Household and dwelling profile
The data covers Anjou borough, which matches the MaisonIQ grouping used for this page.
-0.3 % from 2016 to 2021
Share of owner households in 2021.
Before-tax income reported in the profile.
Median shelter cost: $890 per month.
Housing forms
These shares describe occupied dwellings; they are neither a sales distribution nor a price measure.
Ville de Montréal, 2021 Household and Dwelling Profiles, using Statistics Canada 2021 Census data.
Published data
Displayed data has passed source, period, geography, and quality controls. Missing data remains unavailable instead of being estimated or replaced with zero.
Housing-unit count published by the Ville de Montréal for the housing-reference areas composing the geography.
Statistics Canada monthly index for new housing, house and land combined, December 2016 = 100.
Twelve-month change calculated from Statistics Canada’s New Housing Price Index.
Sources and method
Method: missing or stale data is shown as unavailable and is never replaced with zero.
Home IQ
Enter an address to connect area context with the available property facts.
Market alert
Receive a monthly report only when approved data is available.